
Lock volume rises 13% month over month as spring buying season gains traction
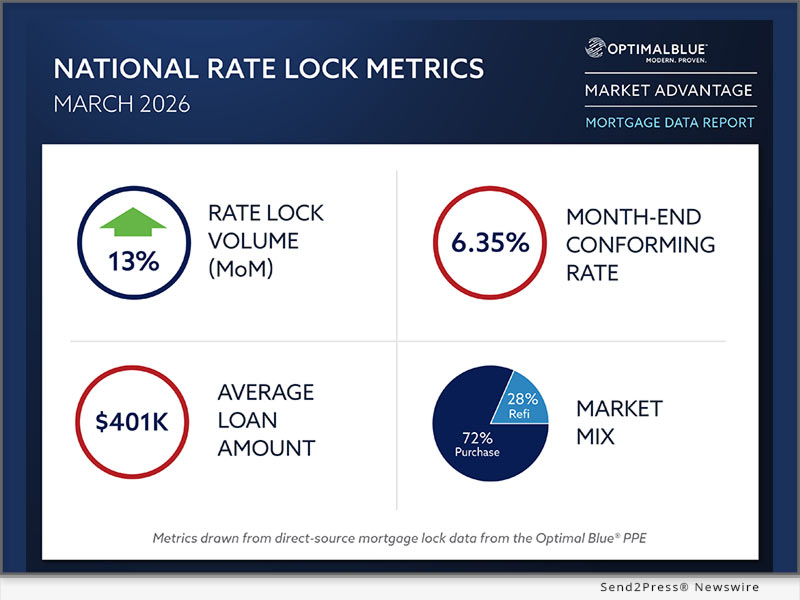
PLANO, Texas /New York Netwire – National News/ — Optimal Blue today released its March 2026 Market Advantage mortgage data report, reflecting resilient mortgage activity as purchase demand strengthened despite higher rates. Total rate-lock volume rose 13% month over month (MoM) and 26% year over year (YoY). Purchase activity led the month, with purchase lock volume up 38% from February and 20% from March 2025. Cash-out refinance volume increased 9% MoM and 21% YoY, while rate-and-term refinance volume declined 34% from February but remained more than 66% higher YoY. Refinance share finished March at 28% of total production, down from earlier in the year but still well above 2025 levels.
Mortgage rates moved higher across all major products in March. The Optimal Blue Mortgage Market Indices (OBMMI) 30-year conforming fixed rate, the benchmark for CME Group’s Mortgage Rate futures, ended the month at 6.35%, up 45 basis points (bps) from February. Jumbo, VA and FHA rates also increased during the month. The 10-year Treasury yield ended March at 4.30%, up 33 bps, while the spread between the 10-year Treasury and the 30-year rate widened to 205 bps.
“Purchase demand is carrying the market forward even as rates move higher,” said Mike Vough, senior vice president of corporate strategy at Optimal Blue. “That’s a strong sign for the spring market, especially with refinance share still at 28%, well above where it spent most of 2025.”
On the secondary side, March data reflected modest shifts in execution. Best-efforts-to-mandatory spreads tightened for 30-year products, while agency cash window executions increased 100 bps and securitization activity eased. Mortgage servicing rights (MSR) values also rose 6 bps as higher rates reduced refinance expectations.
“In a higher-rate environment, lenders have to be more deliberate about how they execute and where they find value,” Vough said. “We saw some movement toward the cash window in March, but the more telling signal was MSRs moving higher as refinance expectations came down. That’s the market adjusting to a higher-rate backdrop.”
Key findings from the Market Advantage report, derived from direct-source mortgage lock and secondary market data, include:
Volume trends and market composition
* Refinance share eases: Refinances accounted for 28% of total lock volume in March as purchase demand accelerated. Rate-and-term refinance volume declined 34% MoM but remained more than 66% higher YoY, while cash-out refinance volume increased 9% MoM and 21% YoY.
* Purchase share expands: Purchase locks accounted for just over 71% of total volume in March, with purchase activity rising 38% MoM and 20% YoY as the market moved deeper into the spring selling season.
* Conforming’s majority narrows: Conforming share declined to just over 50% of total volume in March. FHA and non-conforming share each increased to 18%, while VA share eased to 13% and USDA held steady at 1%.
* ARM usage climbs: Adjustable-rate mortgages accounted for 12% of total production in March, up 162 bps MoM and reaching the highest mark since October 2022.
* PUD share rises: Planned unit developments, a proxy for new construction activity, rose to 28% of total volume in March, up 75 bps MoM but down 413 bps YoY.
Rates and pricing
* Rates move higher: The OBMMI 30-year conforming fixed rate rose 45 bps to 6.35%. Jumbo rates increased 41 bps, VA rates rose 44 bps and FHA rates climbed 21 bps. The 10-year Treasury yield increased 33 bps to 4.30%, while the mortgage-to-Treasury spread widened to 205 bps.
* MSR values rise: MSRs for conforming 30-year loans increased 6 bps to 1.24%, representing a 4.97 multiple, as higher rates reduced refinance expectations.
* Execution spreads tighten: Best-efforts-to-mandatory spreads decreased 3 bps for conventional 30-year loans and 5 bps for government 30-year loans, while the conforming 15-year spread increased 7 bps.
* Top pricing share slips: The share of loans sold at the highest price tier declined 100 bps to 79%, while loans sold in the fourth (or worse) tier decreased 100 bps to 4%.
Channel and execution
* MBS share slips: Agency mortgage-backed securities (MBS) securitizations accounted for 41% of hedged executions, down slightly from 42% the prior month.
* Cash window gains ground: Hedged loan sales to the agency cash window rose 100 bps to 28%.
Product mix and borrower profiles
* First-time buyer share remains high: First-time homebuyers represented 46% of conforming purchase locks and more than 70% of FHA volume in March, while VA first-time buyer share held near 46%. Conforming first-time buyer share was up 3 points over the past three months and 1 point year over year.
* Borrower profiles remain stable: Debt-to-income (DTI) ratios for purchase loans were 36.3% for conforming loans, 43.3% for FHA and 42.7% for VA in March. Conforming purchase DTI was essentially flat from February, while FHA and VA purchase DTIs moved modestly lower. All three remained below year-ago levels. The average purchase FICO was 732.
* Loan balances stay elevated: Average loan amount declined to just over $401,000 from $404,586 in February but remained well above year-ago levels. The average loan-to-value ratio (LTV) was 81.32%. Loan amounts ranged from $888,536 in greater San Francisco to $306,283 in Indianapolis, while regional LTVs ranged from 69.88% in the Bay Area to 89.47% in San Antonio.
To view the full March 2026 Market Advantage report, complete the free subscription form: https://engage.optimalblue.com/market-advantage.
Subscribers receive a report PDF each month with the latest data. Members of the press are eligible for special, advance access each month and should contact Leslie Colley to be added to the media list.
About the Market Advantage Report
Optimal Blue issues the Market Advantage mortgage report each month to provide insight into U.S. mortgage trends and drivers of lending profitability. Data is sourced from the Optimal Blue PPE, which is used to price and lock more than one-third of all mortgages nationwide, and Optimal Blue’s hedging and loan trading system, which supports approximately 40% of loans hedged and sold into the secondary market. As the leader in mortgage capital markets technology, Optimal Blue has a direct view of both origination and secondary market activity and the interconnectedness of the two. Unlike self-reported survey data, Optimal Blue’s direct-source data accurately reflect the in-process loans in lenders’ pipelines and secondary market executions. Visit Optimal Blue’s website to subscribe to receive the free report each month.
Nothing herein shall be construed as, nor is Optimal Blue providing, any legal, trading, hedging or financial advice.
About Optimal Blue
Optimal Blue powers profitability across the mortgage capital markets ecosystem. As the industry’s only end-to-end capital markets platform, our technology, data and integrations bridge the primary and secondary markets to help lenders of all sizes maximize performance – from pricing accuracy to margin protection and every step in between. Backed by over 20 years of proven expertise, our modern, cloud-native technology delivers the real-time automation, actionable data and seamless connectivity lenders need to navigate market volatility and scale for growth. To learn more about how Optimal Blue delivers measurable ROI, visit OptimalBlue.com.
Learn More: https://www2.optimalblue.com/
This version of news story was published on and is Copr. © 2026 New York Netwire (NewYorkNetwire.com) – part of the Neotrope® News Network, USA – all rights reserved.
Information is believed accurate but is not guaranteed. For questions about the above news, contact the company/org/person noted in the text and NOT this website.
NEWS SOURCE: Optimal Blue. Story was sourced from a press release issued by Send2Press® and used with permission. View the original story at: https://www.send2press.com/wire/optimal-blue-report-purchase-demand-lifts-mortgage-lock-activity-as-rates-rise/


